| .gitea/workflows | ||
| screenshots | ||
| .gitignore | ||
| compose.timescaledb.yml | ||
| compose.yml | ||
| Dockerfile | ||
| example.env | ||
| go.mod | ||
| go.sum | ||
| LICENSE.md | ||
| main.go | ||
| README.md | ||
P1 logger
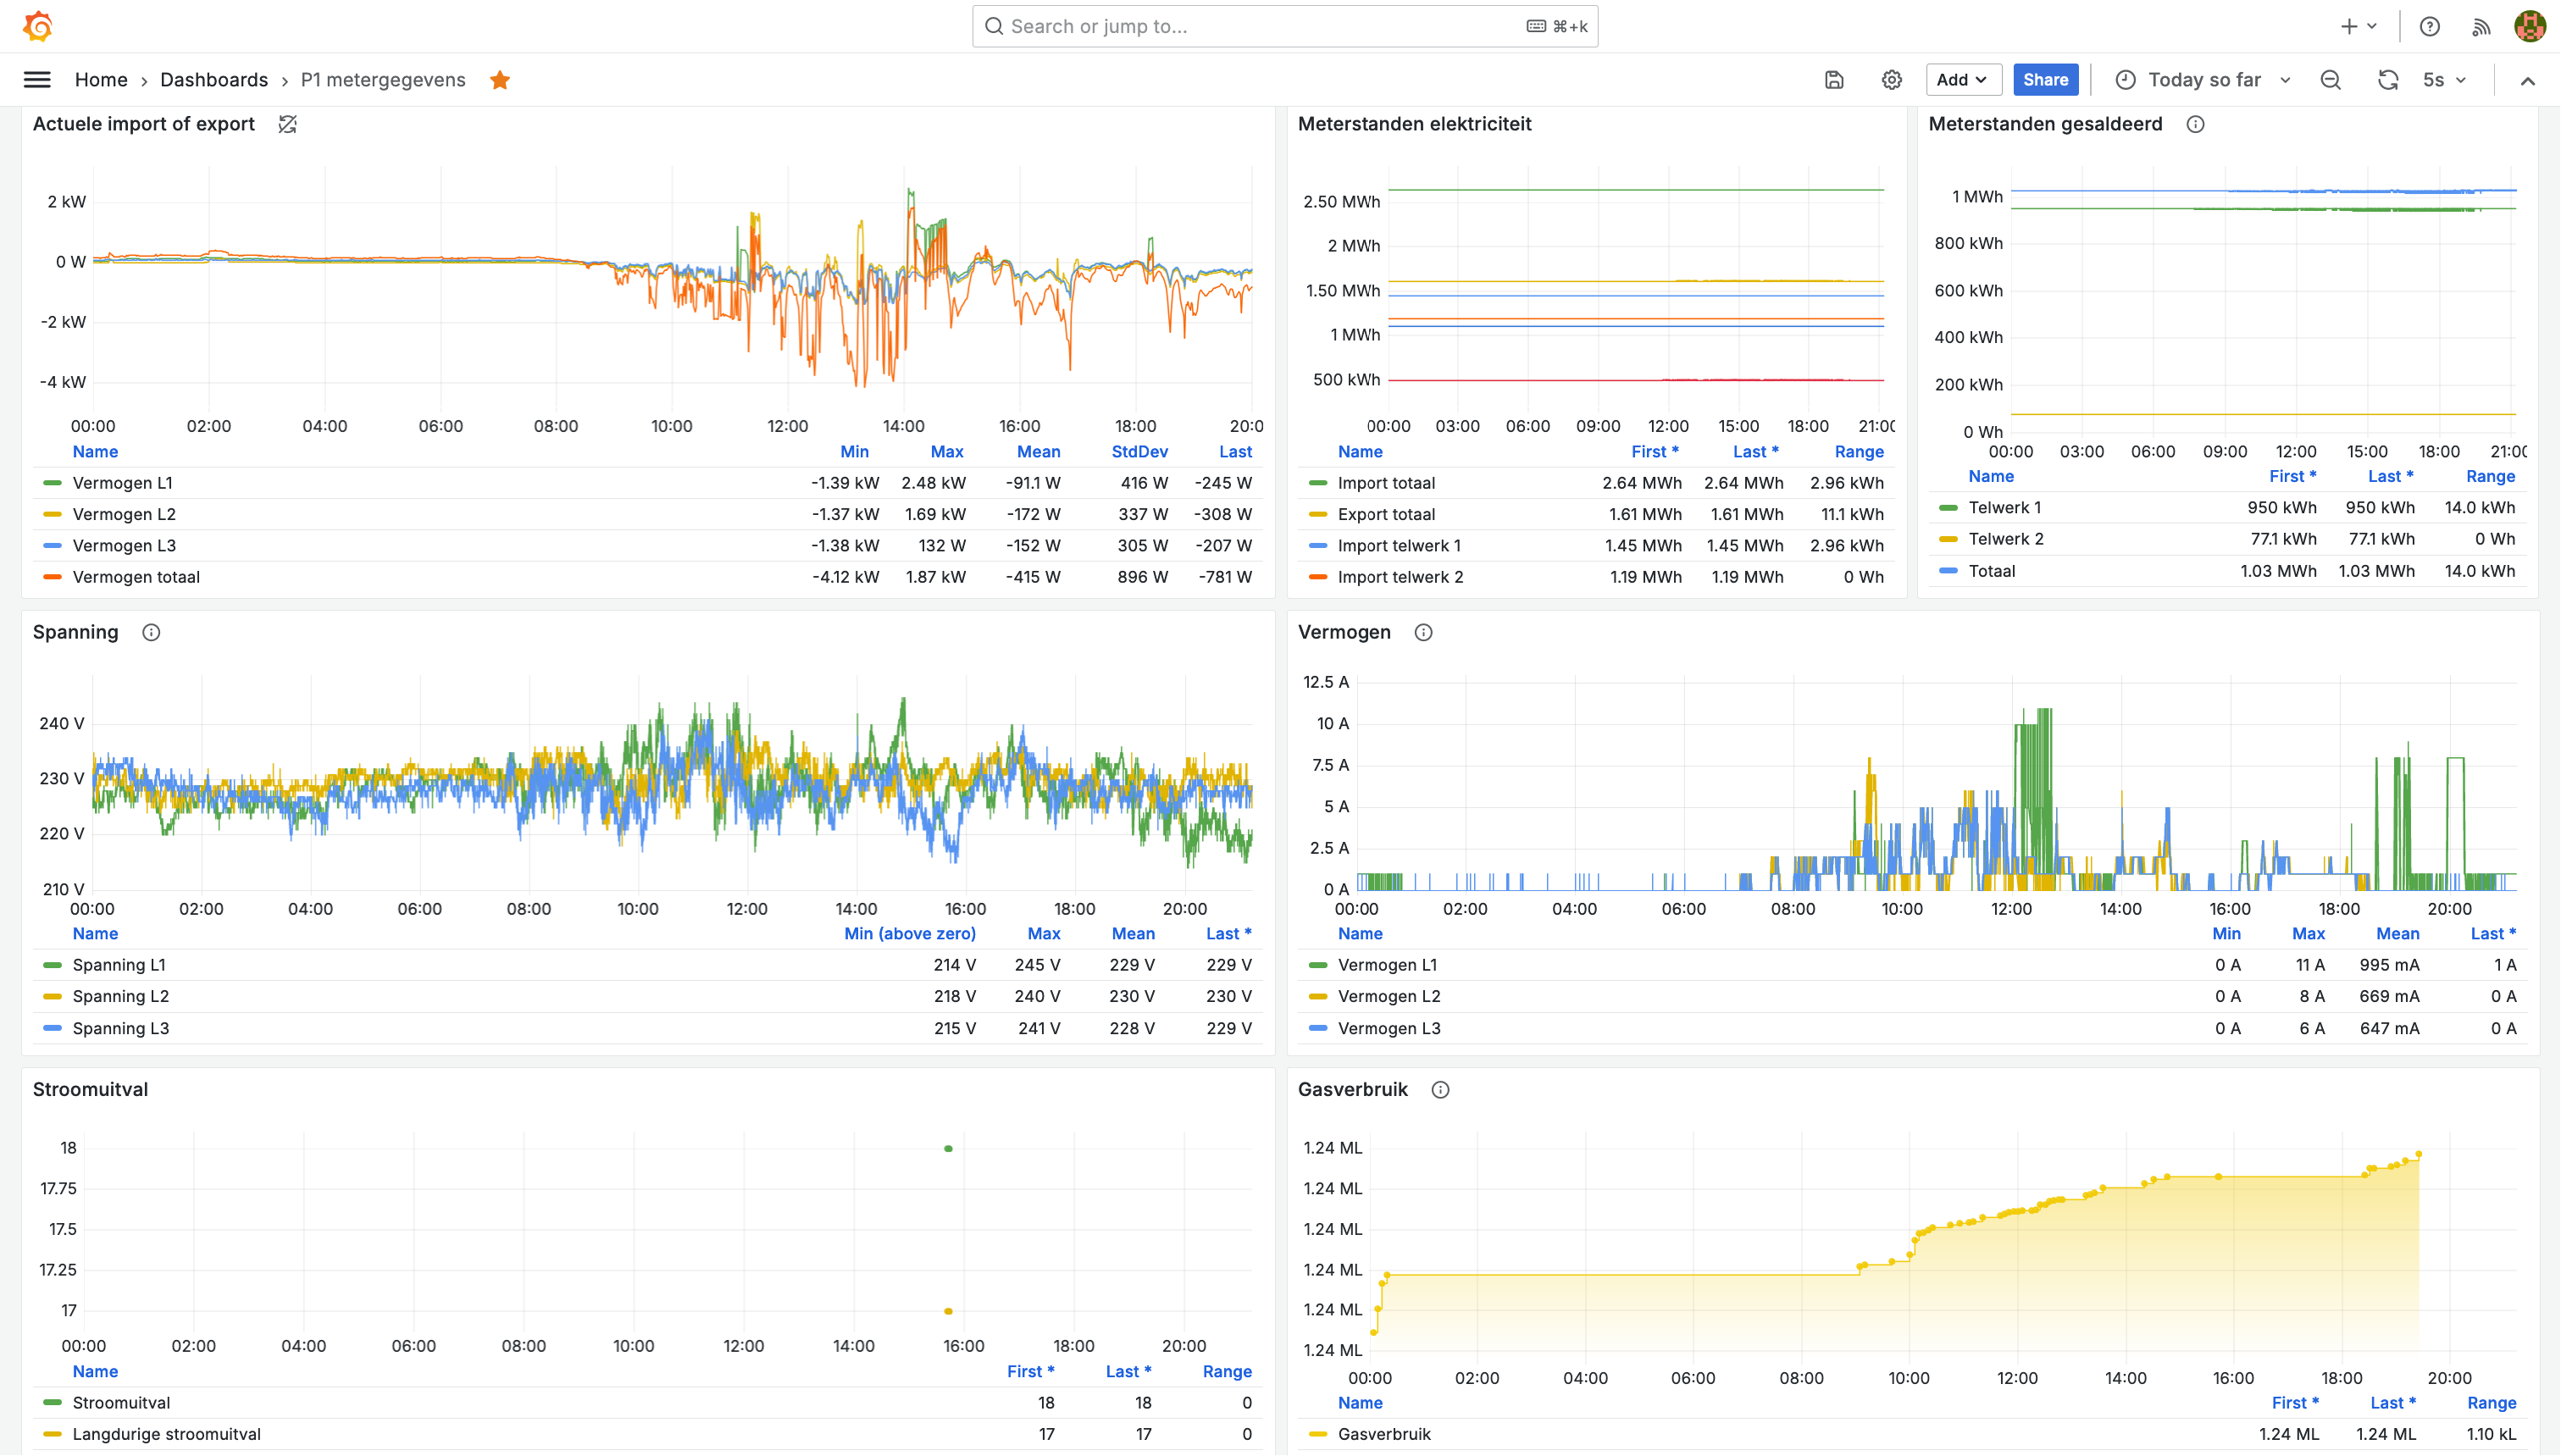
P1 logger is a tool designed to store meter data conforming to the ESMR or DSMR (European / Dutch Smart Meter Requirements) standard as efficiently as possible in a PostgreSQL database. Optionally, TimescaleDB is supported. The data can easily be retrieved using tools such as Grafana for visualisation and analysis.
Background: data storage architecture
P1 logger aims to store detailed meter data as efficiently as possible. Therefore, a few design choices were made.
All metrics are stored as INT and not NUMERIC or FLOAT to optimise their storage size.
Dt1, Dt2, Rt1, Rt2, G, F and Fl are cumulative meter readings. Therefore, they function as counters that can only go up. By making them pointers to int, they can be set to 'nil' whenever a reading has not changed. This way, they are logged as NULL in the database when no change has happened, saving storage capacity. As an added benefit, this makes data retrieval, visualisation and analysis more light-weight.
Typical P1 meters update gas consumption once per minute. Not saving intermittent values theoretically saves 4 bytes per value. An average month has 43,829.0639 minutes. 4*43,829.0639 = 175,316.26 bytes = 0.18 MB
In practice, storage will be even lower, as gas is usually not consumed continuously. Therefore, a new metric won't be available for every minute.
When Tariff 1 is active, Tariff 2 isn't. When energy is being imported, it is not being returned. Therefore, only updating their values on-change should save at least 75% storage capacity requirements An average month has 2,629,743.83 seconds.
This saves at least: 2,629,743.83 seconds * 4 bytes = 10,518,975.32 bytes = 10,518.98 kB = 10.52 MB This applies both to Dt1 and Dt2 as well as Rt1 and Rt2, only one is recorded at a time. 10.52 * 3 = 31.56 MB.
In addition, many meters only update these metrics once every 10 seconds, meaning even more storage capacity is saved: 10.52 / 10 * 9 = 9,468 MB.
For D1-3 and R1-3, either Dx or Rx will be active. Therefore, their storage requirements can be sliced in half, saving 3 * 10.52 = 42.08 MB. This is different for D and R, as these contain the sum of each phase and are reported simultaneously. Not saving failures when there is no change, will save around 10.52MB per month per metric, so an additional 21.04MB.
Theoretical storage requirements for a DSMR5 meter with metrics emitted every second
| Column | Column size (bytes) | Per month (MB) | X | Total (MB) |
|---|---|---|---|---|
| Timestamp | 8 bytes | 21.04 | ||
| Dt1, Dt2, Rt1, Rt2 | 4 bytes | 1.05 | ||
| D, R | 4 bytes | 10.52 | ||
| R | 4 bytes | 10.52 | ||
| F | 4 bytes | 0.00 | ||
| Fl | 4 bytes | 0.00 | ||
| G | 4 bytes | 0.18 | ||
| V1-3, C1-3 | 4 bytes | 10.52 | 6 | 63.12 |
| D1-3, R1-3 | 4 bytes | 10.52 | 3 | 31.56 |
| Total | 137.99 |
Theoretical storage requirements without optimisations
| Column | Column size (bytes) | Per month (MB) | X | Total (MB) |
|---|---|---|---|---|
| Timestamps | 8 bytes | 21.04 | ||
| Values | 4 bytes | 10.52 | 21 | 220.92 |
| Total | 241.96 |
At the expense of having to create more complicated queries for analysis and visualisation, the optimisations save at least 103.97 MB or 1-137.99/241.96 = 43% in uncompressed storage space per month.
Real-world experiences
In practice, the storage requirements are lower than those mentioned in the aforementioned theoretical calculations. Over 8 months, I collected a database of 1.04GB of metrics. Using ZSTD with the default level 3, the database can be compressed to just 12.77% of this.
zstd p1_backup.sql
p1_backup.sql        : 12.77%   (  1.04 GiB =>    136 MiB, p1_backup.sql.zst)
It is therefore recommended to use filesystems supporting compression, such as BTRFS. The P1 logger operating on a btrfs filesystem with compression enabled at default levels, can store the aforementioned 1.04GB of metrics in just 136MB of physical disk space. With the highest ZSTD compression level, 19, the 1.04GB database is stored in just 8.14% of its original size.
zstd -19 p1_backup.sql
p1_backup.sql        :  8.14%   (  1.04 GiB =>   86.6 MiB, p1_backup.sql.zst)
Storage requirements conclusion
Extrapolating on the real-world data, a full year of P1 metrics logged by this program can be stored in in around 233MB of physical disk space.
Columns
Data is stored in a table containing the following columns
- timestamp
- delivered_tariff1, delivered_tariff2, returned_tariff1, returned_tariff2
- delivery_all
- returning_all
- failures
- long_failures
- gas
- voltage_l1, voltage_l2, voltage_l3
- current_l1, current_l2, current_l3
- delivery_l1, delivery_l2, delivery_l3
- returning_l1, returning_l2, returning_l3
Input: P1 reader
P1 Logger relies on a JSON input provided by a P1 reader.
The P1 reader should send its data to an MQTT broker. Each message should be in the following JSON structure.
{
    "t":"240615205754S",
    "dt1":1448411,
    "dt2":1188886,
    "rt1":498463,
    "rt2":1111828,
    "d":0,
    "r":121,
    "f":18,
    "fl":17,
    "g":1238688,
    "v1":228,
    "v2":231,
    "v3":230,
    "c1":0,
    "c2":0,
    "c3":0,
    "d1":0,
    "d2":0,
    "d3":4,
    "r1":41,
    "r2":71,
    "r3":0
}
This is currently achieved using an ESP32 with ESPhome. Configuration files for the ESP32 setup will be added soon.
