5.1 KiB
OpenDTU Logger Home Assistant add-on
OpenDTU logger adds detailed, long-term storage and visualisation of Hoymiles solar inverter metrics monitored with OpenDTU.
Installation instructions
These instructions contain 3 steps:
- This add-on requires a PostgreSQL database, optionally with TimescaleDB support. In this example, we'll Expaso's TimescaleDB add-on in order to store data.
- Then, we install OpenDTU Logger to connect to OpenDTU and record inverter data into the database.
- Finally, we setup Grafana to visualise the data recorded by OpenDTU Logger.
Install Expaso's TimescaleDB add-on
Install Expaso's TimescaleDB add-on by adding https://github.com/Expaso/hassos-addons to the add-on store and installing TimescaleDB.
After installing TimescaleDB, go to Configuration. Click the three dots in the top-right corner and select "Edit in YAML". Then, make the following changes:
- Add opendtu_logger to
databasesandtimescaledb_enabledlike so:
databases:
  - homeassistant
  - opendtu_logger
timescale_enabled:
  - homeassistant
  - opendtu_logger
timescaledb:
  telemetry: basic
  maxmemory: 512MB
  maxcpus: 4
max_connections: 50
system_packages: []
init_commands: []
retry_upgrade: false
Save the configuration, go to the "Info" tab and start TimescaleDB.
Setting up OpenDTU Logger
With the database initialised, we can now setup OpenDTU Logger. Add the add-on repository using the instructions provided. Then, click "Install" to install this add-on. Go to "Configuration".
- If you're using Expaso's TimescaleDB add-on, the
dbsetting will not require any changes. - In the
opendtufield, enter the IP address or hostname of your OpenDTU. E.g.:192.168.1.5oropendtu.local. - In
tz, enter your timezone. The default is "Europe/Amsterdam". - Optionally, if you don't want to use TimescaleDB, disable
timescaledb.
Save the configuration, go to the "Info" tab and start OpenDTU Logger.
Check the "Log" page. If the setup is succesfull, it should contain a mesasge stating: OpenDTU Logger has been successfully initialised. Starting data recording....
Setting up Grafana
From the Home Assistant Community Add-ons repository, install Grafana. Click "Start" to start the add-on and then click "Open Web UI".
- In the top-left corner, click the three bars (open menu) -> Connections.
- Using the search box, enter
PostgreSQL. Click the resulting "PostgreSQL". - In the top-right corner, click "Add new data source"
- Use the following settings
- Name:
opendtu_logger - Host URL:
77b2833f-timescaledb - Database name:
opendtu_logger - Username:
postgres - Password:
homeassistant - Version:
16or the closest version to it. - TimescaleDB: Toggle the switch to enable TimescaleDB support.
- Name:
- Click "Save and Test". A "Database Connection OK" message should appear.
- In the top-right corner, click the
+sign, "Import dashboard". - Go to https://git.hollander.online/energy/opendtu-logger/src/branch/main/grafana
- In this folder, a number of sample dashboards is available.
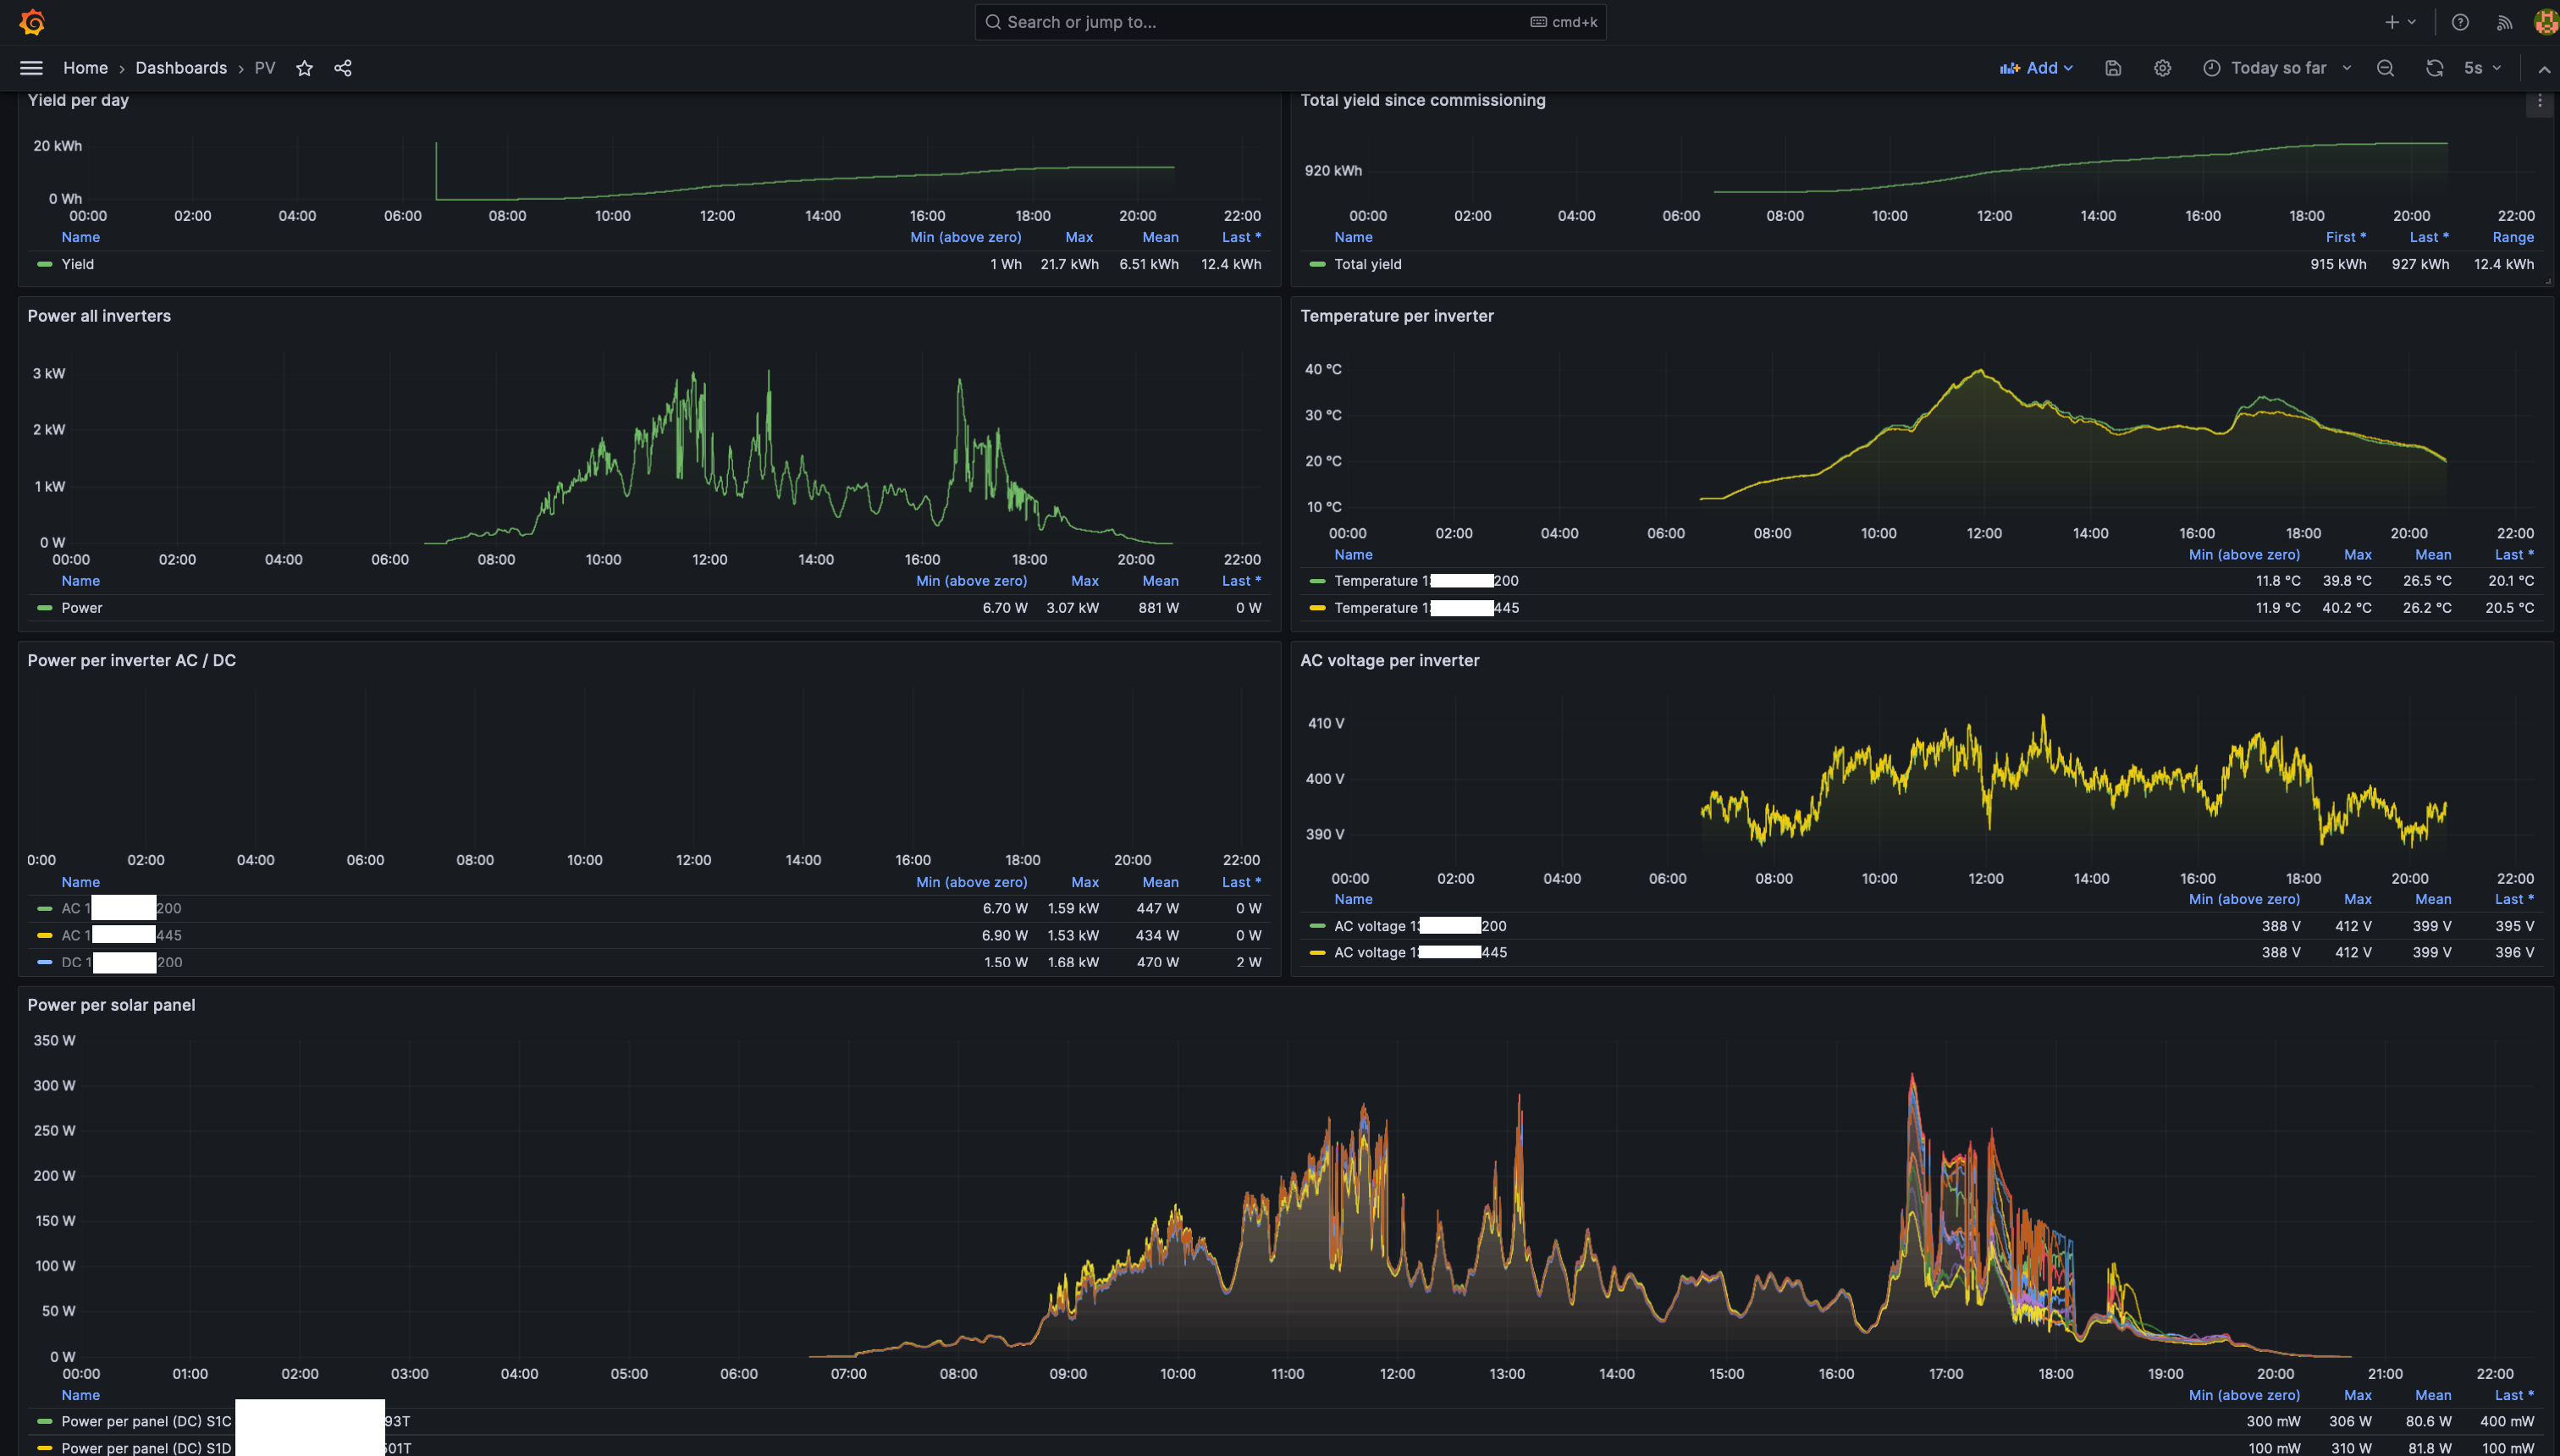
- For a complete overview of all collected data
- For English, use
PV.json. - For Dutch, use
Zonnepanelen.json.
- For English, use
- Click the dashboard you want, and then "Raw".
- Copy and paste the text into the "Import via dashboard JSON model" box.
- Click "Load".
- In the
energyfield, selectopendtu_loggeras the data source. - Click import. You should now be able to view the data, collected by OpenDTU Logger and stored into TimescaleDB.
- Feel free to try out the other dashboards as well.
Configuring OpenDTU
In order for OpenDTU Logger to work properly, it is required to ensure the following OpenDTU settings are used.
- Within OpenDTU, go to
Settings->Inverter settings(http://YOUR_OPENDTU_IP_ADDRESS/settings/inverter). - For each inverter in the inverter list, click on the pencil (Edit inverter) and go to
Advanced. - Enable
Zero daily yield at midnightandClear Eventlog at midnight. - Click
Save - Repeat this procedure for every inverter.
By default, OpenDTU sends data every 5 seconds. This can be adjusted by changing the "Poll interval" setting in <http://YOUR_OPENDTU_IP_ADDRESS/settings/dtu.
Security notice
Using the aforementioned steps, you should now have a working OpenDTU Logger setup. However, it is important to keep your data safe. Expaso recommends changing the default postgres homeassistant password. I recommend following their recommendation and also installing the pgAdmin4 add-on using the instructions they provide. In case you're doing this after setting up OpenDTU Logger, remember to also update this password in the OpenDTU Logger config and the Grafana data source connection settings.