- Go 98.9%
- Dockerfile 1.1%
|
|
||
|---|---|---|
| .claude/rules | ||
| .forgejo/workflows | ||
| config | ||
| docker | ||
| grafana | ||
| handler | ||
| migrations | ||
| model | ||
| opendtu | ||
| screenshots | ||
| store | ||
| systemd | ||
| .gitignore | ||
| .mcp.json | ||
| Dockerfile | ||
| go.mod | ||
| go.sum | ||
| LICENSE | ||
| main.go | ||
| README.md | ||
| renovate.json | ||
OpenDTU logger
OpenDTU logger adds detailed, long-term storage and visualisation of Hoymiles solar inverter metrics monitored with OpenDTU:
- It connects to the OpenDTU livedata websocket and captures metrics.
- These metrics are inserted into a PostgreSQL database. Optionally, TimescaleDB can be used.
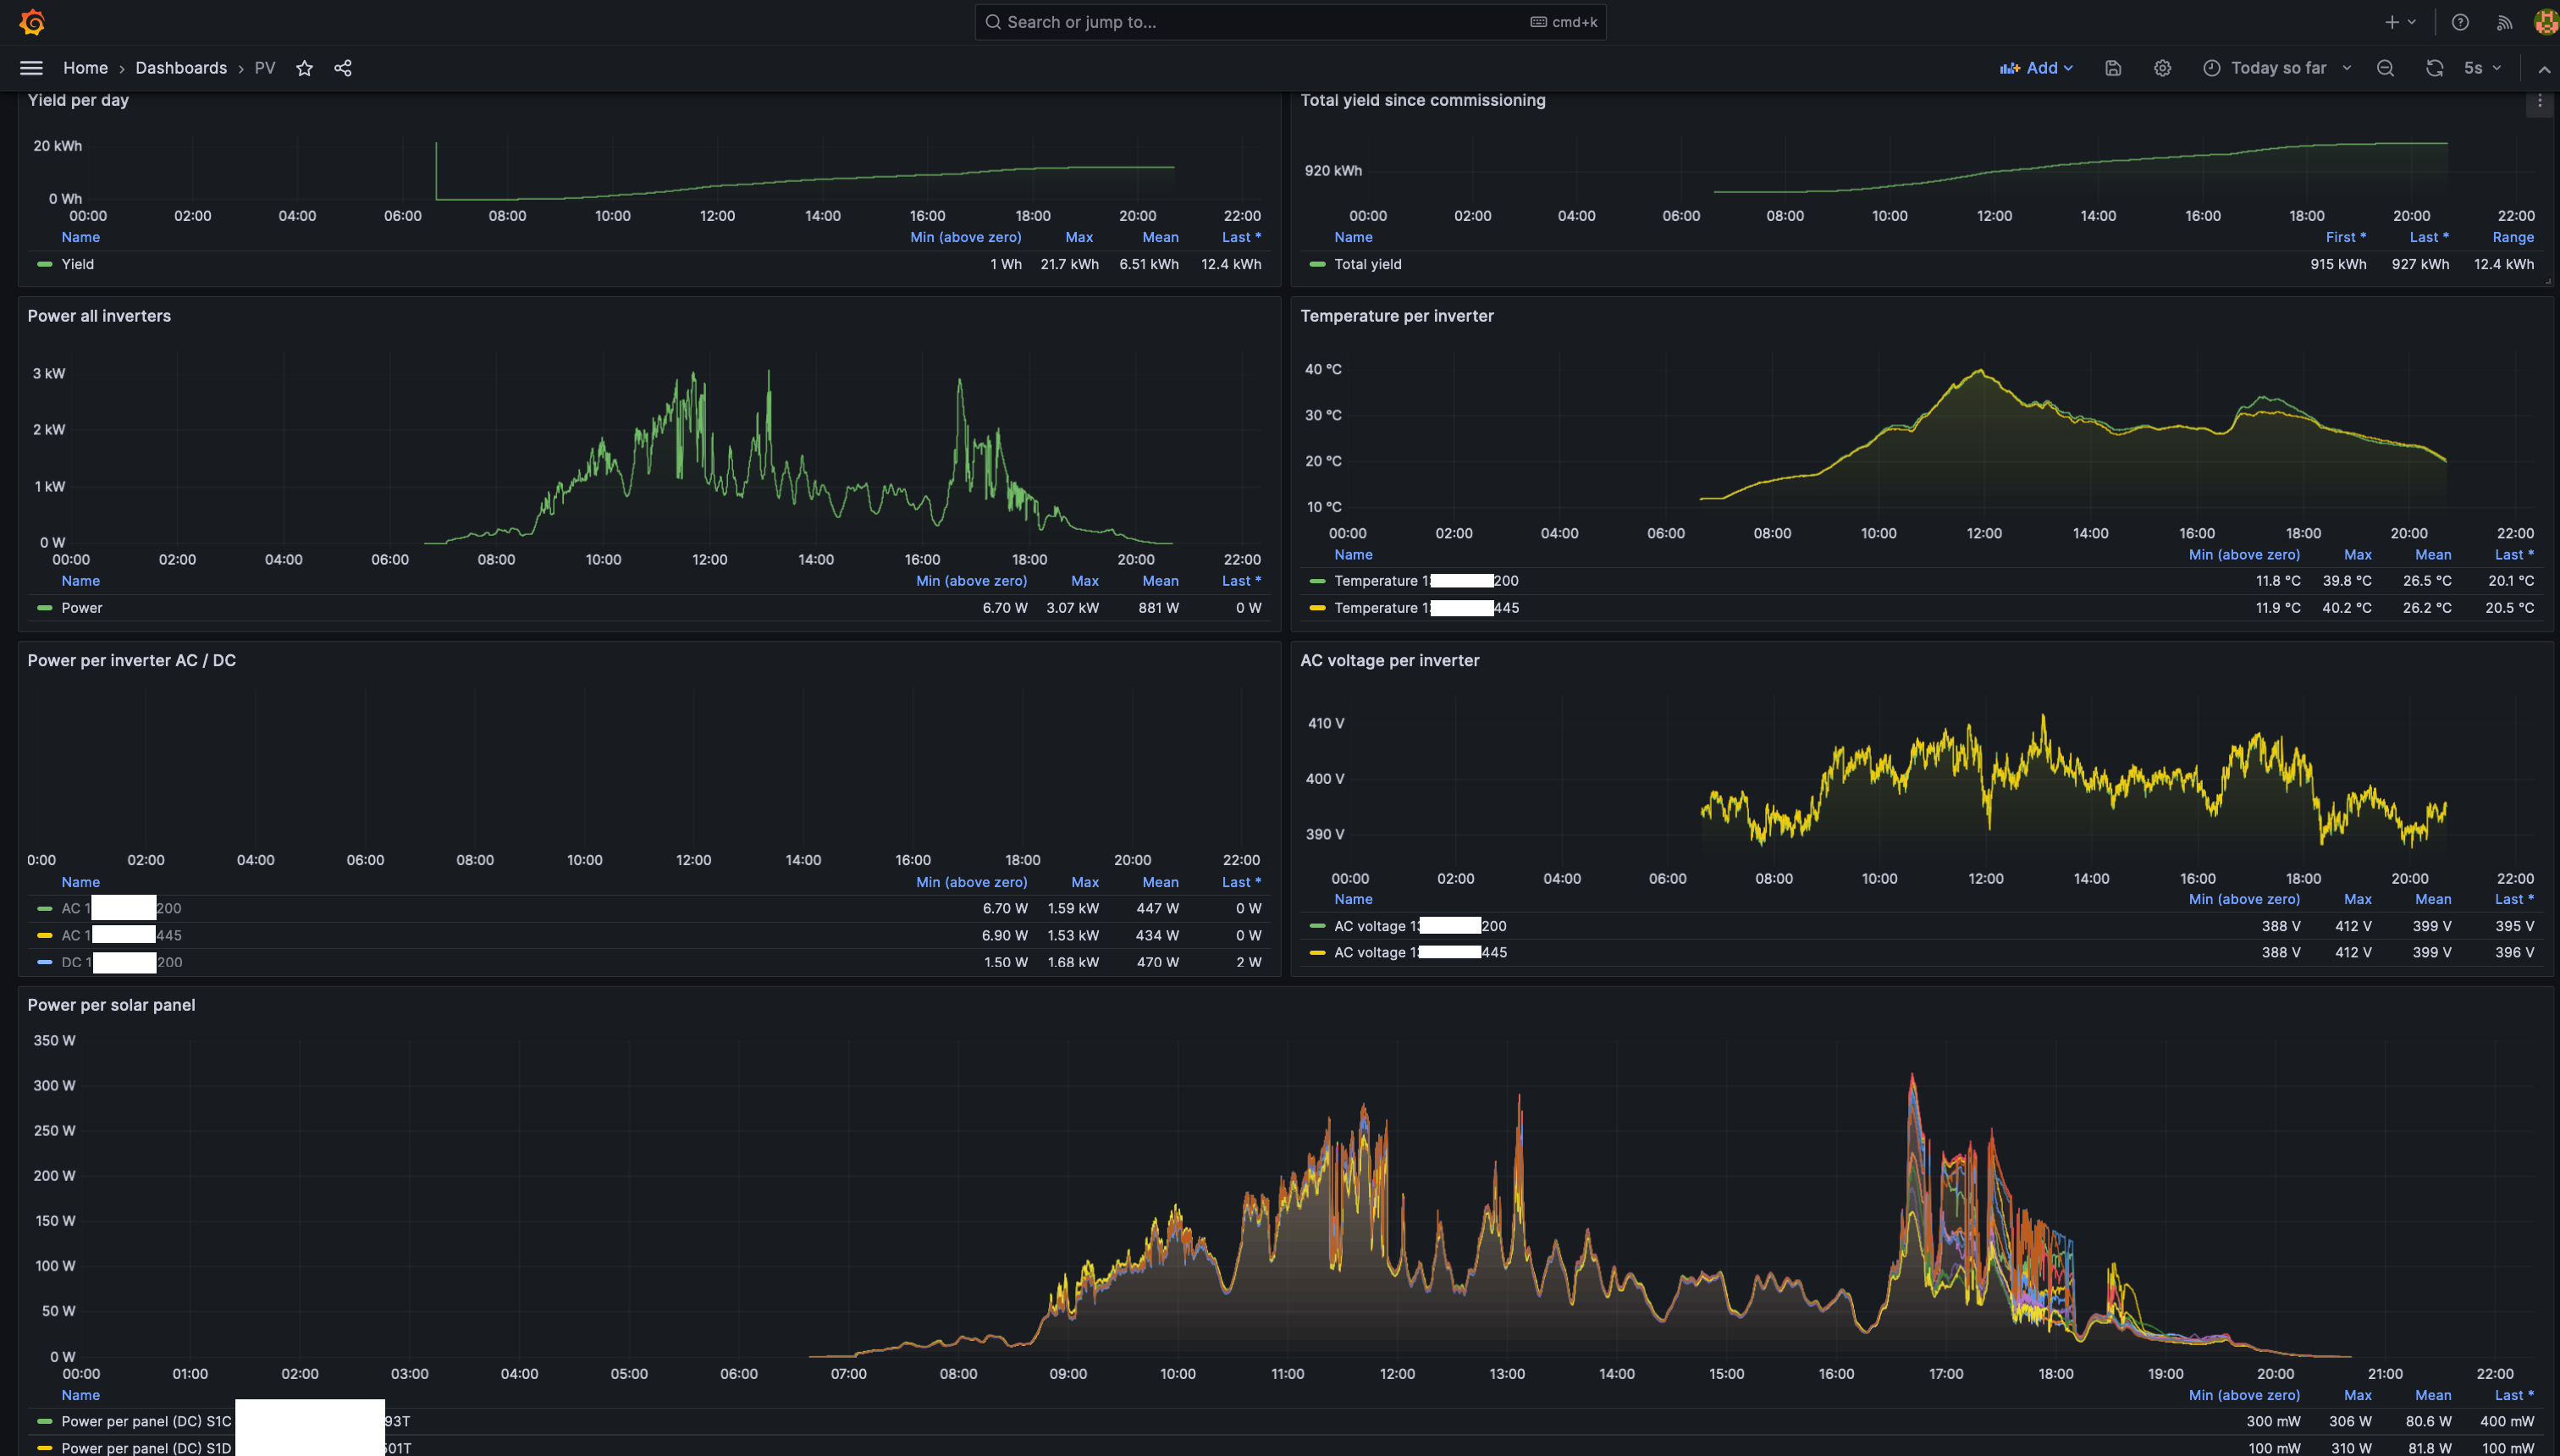
- Included in OpenDTU Logger are a number of Grafana dashboards, which can be used to provide useful visualisations and insights.
- The image below shows the PV dashboard of a given day in dark mode. Light mode is also supported. Hovering over the graphs will result in a tooltip, providing the exact values recorded at a given time.
OpenDTU logger installation instructions
OpenDTU logger can be installed in different ways:
- Using the Home Assistant add-on repository.
- Using Docker Compose
- Using the binary available on the releases page
- Compiling the code yourself.
Using the Home Assistant add-on or Docker Compose is the preferred way to install OpenDTU Logger.
Installation on Home Assistant can be done by adding the Home Assistant add-on repository to the Home Assistant add-on store and following the instructions provided. Other installation methods are described below.
Configuring OpenDTU
In order for OpenDTU Logger to work properly, it is required to ensure the following OpenDTU settings are used. OpenDTU Logger has been tested with OpenDTU versions v24.6.10 - v26.3.30.
- Within OpenDTU, go to
Settings->Inverter settings(http://YOUR_OPENDTU_IP_ADDRESS/settings/inverter). - For each inverter in the inverter list, click on the pencil (Edit inverter) and go to
Advanced. - Enable
Zero daily yield at midnightandClear Eventlog at midnight. - Click
Save - Repeat this procedure for every inverter.
For improved security, it is recommended to disable "Allow readonly access to web interface without password" in Settings -> Security (http://YOUR_OPENDTU_IP_ADDRESS/settings/security).
Docker Compose
The docker folder in this repository contains example Docker compose files. The compose.with-database-grafana.yml file contains a full setup suitable for a standalone deployment. The other compose files are aimed at integration into existing environments.
To use the standalone deployment, take the following steps
Enter the docker folder
cd docker
Copy example.with-database.env to .env. E.g.:
cp example.with-database.env .env
In the .env file:
- Edit the
REMOTE_URLto point to your OpenDTU. - In
DB_URLalter thepasswordfield. Set the same value in.PG_PASSWORD
Deploy the Docker containers by running the following command from the docker folder.
docker compose -f compose.with-database-grafana.yml up
Docker should now start downloading the required containers and bring up OpenDTU Logger, TimescaleDB and Grafana. If everything seems ok, press CTRL + C to stop the containers. Next, execute
docker compose -f compose.with-database-grafana.yml up -d
The -d flag ensures that the containers are started in the background, so you can safely close your terminal window. If desired, containers running in the background can be stopped by running compose again with the down command.
docker compose -f compose.with-database-grafana.yml down
Setting up Grafana
After deploying OpenDTU Logger with Docker Compose, Grafana should be available at http://localhost:3000.
The initial login username and password are admin:admin. After the initial login, Grafana will request you to change the password to something more secure.
Configuring the OpenDTU Logger data source
After logging in, go to Connections -> Data sources -> Add new data source.
- Under
SQLselectPostgreSQL. - Change the following fields
Host URL:timescaledb:5432Database name:opendtu_loggerUsername:postgresPassword: The password you set in the.env.file in the previous step.TLS/SSL Mode:disableTimescaleDB: set the slider toenable
- Click
Save and test- You should get a green box with a
Database Connection OKmessage.
- You should get a green box with a
Adding the OpenDTU Logger dashboards
Now that the data source has been configured, we can add our dashboards.
- Go to
Dashboards->New->Import. - Upload
PV.jsonfrom thegrafanafolder in this repository - After uploading, Grafana requests you to configure a data source. Select the data source configured in the previous step. Click
Import. The dashboard should now be ready. - If you want more dashboards, import the other dashboards from the
grafanafolder as well, or create your own.
Binary
Go to the releases page and download the most recent stable release.
Running the binary as local user
REMOTE_URL="opendtu:80" DB_URL="host=localhost port=5432 user=postgres password=secret dbname=dtu sslmode=disable" TIMESCALEDB_ENABLED="true" TZ="Europe/Amsterdam" ./opendtu-logger
Creating a more permanent setup on Linux using systemd
sudo adduser --system --group --disabled-login --home /opt/opendtu-logger opendtu-logger

sudo mkdir /opt/opendtu-logger
sudo mkdir /opt/opendtu-logger/data
sudo mv ./opendtu-logger /opt/opendtu-logger/

sudo chown -R opendtu-logger:opendtu-logger /opt/opendtu-logger
sudo nano /etc/systemd/system/opendtu-logger.service
Add the contents of systemd/opendtu-logger.service and alter the REMOTE_URL and DB_URL environment variables to match your setup.
PostgreSQL setup
To install PostgreSQL on Debian / Ubuntu run
sudo apt install postgresql
The OpenDTU logger logs to a PostgreSQL database and optionally supports TimescaleDB. Create a separate database and user using the following commands.
CREATE DATABASE opendtu_logger;
CREATE USER opendtu_logger WITH password 'SECRET';
GRANT ALL privileges ON DATABASE opendtu_logger TO opendtu_logger;
GRANT ALL ON SCHEMA public TO opendtu_logger;
Optional: enable the TimescaleDB extension. To make use of TimescaleDB, follow the steps outlined in their documentation. Then, enable TimescaleDB support for the opendtu_logger database by executing the following commands
\c opendtu_logger
CREATE EXTENSION OF NOT EXISTS timescaledb;
Environment variables
The following environment variables are required for OpenDTU Logger to be configured.
REMOTE_URL="opendtu:80"
DB_URL="host=localhost port=5432 user=postgres password=secret dbname=dtu sslmode=disable"
TIMESCALEDB_ENABLED="true"
TZ="Europe/Amsterdam"
REMOTE_URLis used to specify the IP address or hostname OpenDTU is running on. E.g.:192.168.1.6oropendtu.internalDB_URLspecifies the credentials required to connect to the PostgreSQL database. All connection parameters documented by golang'slib/pqpackage can be used.TIMESCALEDB_ENABLEDshould be set totrueorfalse.TZis used to ensure data is recorded with the right timestamp. Choose the timezone valid for your location from this Wikipedia page.
Grafana dashboards
The grafana folder contains example dashboards which can be imported into existing Grafana installs, or into the provided Docker Compose with Grafana setup.
- The
opendtu_dashboards contain visualisations for each table the OpenDTU logger records to. PV.jsonis a dashboard which combines the visualisations of each table that I found to be most useful.Zonnepanelen.jsonis the same asPV.json, but in Dutch language.
Known limitations
- The logger currently assumes that events reported by OpenDTU occurred on the current day. This works for the majority of users, as the inverters reset every night when the sun goes down and OpenDTU is configured to forget old events data at midnight. For micro inverters with battery storage added to the PV input side, such as Zendure or Anker Solix, checks still need to be added to account for the fact that these inverters don't necessarily reset every night. Event recording will work, but entries might be recorded multiple times. For more information, see also this OpenDTU Github issue.
- Upon restart of the OpenDTU, the OpenDTU Logger binary needs to be restarted as well. When using the provided
compose.ymlfiles with Docker, or using thesystemdservice file when using the binary, this happens automatically.
Feedback
If you'd like to provide feedback about this project, or in case you'd like to ask questions, please refer to this page for contact information (e-mail, Github or LinkedIn), or use the contact form on my website. You can also respond by placing your remarks in this discussion on Github.